Полезное:
Как сделать разговор полезным и приятным
Как сделать объемную звезду своими руками
Как сделать то, что делать не хочется?
Как сделать погремушку
Как сделать так чтобы женщины сами знакомились с вами
Как сделать идею коммерческой
Как сделать хорошую растяжку ног?
Как сделать наш разум здоровым?
Как сделать, чтобы люди обманывали меньше
Вопрос 4. Как сделать так, чтобы вас уважали и ценили?
Как сделать лучше себе и другим людям
Как сделать свидание интересным?

Категории:
АрхитектураАстрономияБиологияГеографияГеологияИнформатикаИскусствоИсторияКулинарияКультураМаркетингМатематикаМедицинаМенеджментОхрана трудаПравоПроизводствоПсихологияРелигияСоциологияСпортТехникаФизикаФилософияХимияЭкологияЭкономикаЭлектроника

Skim TEXT B (read it quickly noting only chief points). Make a list of topical words and phrases
|
|
TEXT B
Tabular and graphical data
(Reading for vocabulary building)
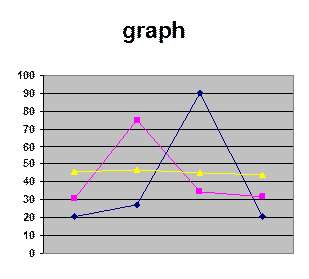
When information is arranged in the form of a list of numbers, a simple picture or a drawing showing a set of measurements we call it tabulated or graphical data. Different kinds of this data are TABLES, CHARTS, GRAPHS and DIAGRAMS. They are used usually with the intention of making it easy to understand. In many cases some of these words (charts, graphs, diagrams) are used interchangeably, but they have differences in shades of meaning.
A learner of English must be skilled in interpreting tables and graphics, i.e. in visual interpretation, as well as in presenting the data in the form of tables, diagrams, etc. One should remember that graphics are primarily concerned with an explanation and description of the object or social and economic trend more than with a representation. They explain something rather than stand for something.
Presenting or interpreting tabulated and graphical data in English requires the correct use of specific phrases, terms, grammar patterns, functional word partnerships (combinations of words). Interpreting charts, graphs and diagrams, presenting them to vividly explain something, summarizing information from them is extremely essential and vital for successful language learning. Visual interpretation is a useful device for developing communication skills. The graph language (diagram/chart language) imparts a feeling of preciseness and exactness to one’s written and spoken English.
NOTES
| table | – a list of numbers, facts or information arranged in rows across and down the page |
| diagram | – a drawing or planthat shows where something is, what it looks like, or how it works |
| chart graph | – information that is clearly arranged in the form of a simple picture, set of figures or a piece of paper with this information on it (таблица, диаграмма, схема, план, график) – a drawing or picture that uses lines or curves to show how two or more sets of measurements are related to each other; in other words, a graph shows the relationship between numbers and measurements that change (график, диаграмма, кривая; bar graph – гистограмма) |
 There are different types of diagrams:


e.g. Sales reached a peak in August, then fell sharply (Sales peaked in August, then fell sharply).
e.g. Sales this month have reached a new peak.
e.g. Inflation rates have reached a plateau after a period of dramatic rise.
e.g. The graph showed peaks and troughs (low points) of activity.
e.g. Inflation has begun to level off.
PHRASE FILE:
– the diagram/the chart shows/indicates/describes/illustrates…
– to draw/construct/plot a graph
– to see smth. from the graph/diagram
– as it is shown in this diagram/this graph…
– to diagram = to show/to represent smth. in a diagram
– a clear/complete/schematic//simple diagram
– to enter the results on the chart/in the diagram
– chart showing last year’s sales…
– to produce a diagram/chart indicating the level of sales
e.g. There was a diagram on the screen.
e.g. The diagram below illustrates this point.
e.g. Mr. Johnson spent four hours measuring and diagramming every
room in the 80-year-old house.
e.g. In the diagram we illustrate the change in sales volume for the last
ten years.
e.g. You will see from the diagram that there are 26 members of the
Executive Committee.
Date: 2016-05-25; view: 577; Нарушение авторских прав